
Tonight I closed the survey I ran for the most of summer. It is the 4th survey in its series, the previous ones, dating 2018, 2020, and 2022 can be viewed on my older blog post.
This year I attempted some modifications – I separated the gender identity question and the assigned gender question and made the former one multiple choice. I also included people who chose to skip the question in the count and reflected these choices in the graph.
I still ended up repeating one of my older mistakes, where I said “men” and “women” rather than “males” and “females” and accidentally made the survey less suitable for children and teenagers who may not identify with adult-centric language. I realized it only several days after the survey was made public and gathered 50+ votes.
Here are the results:
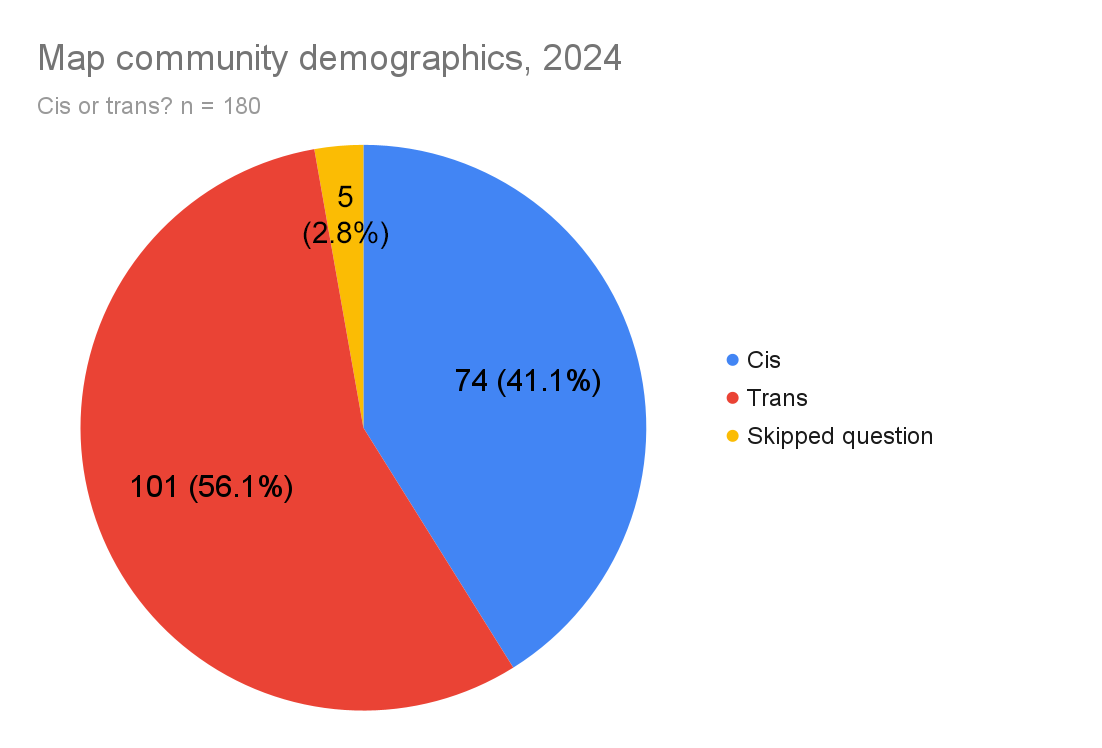
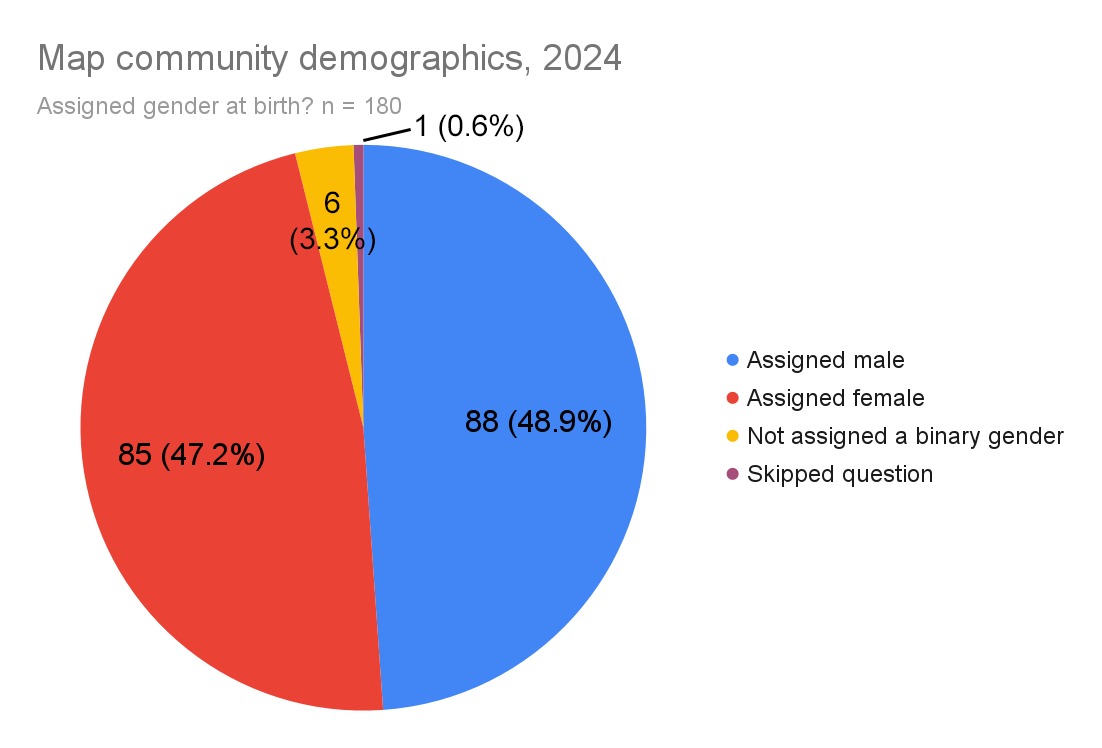
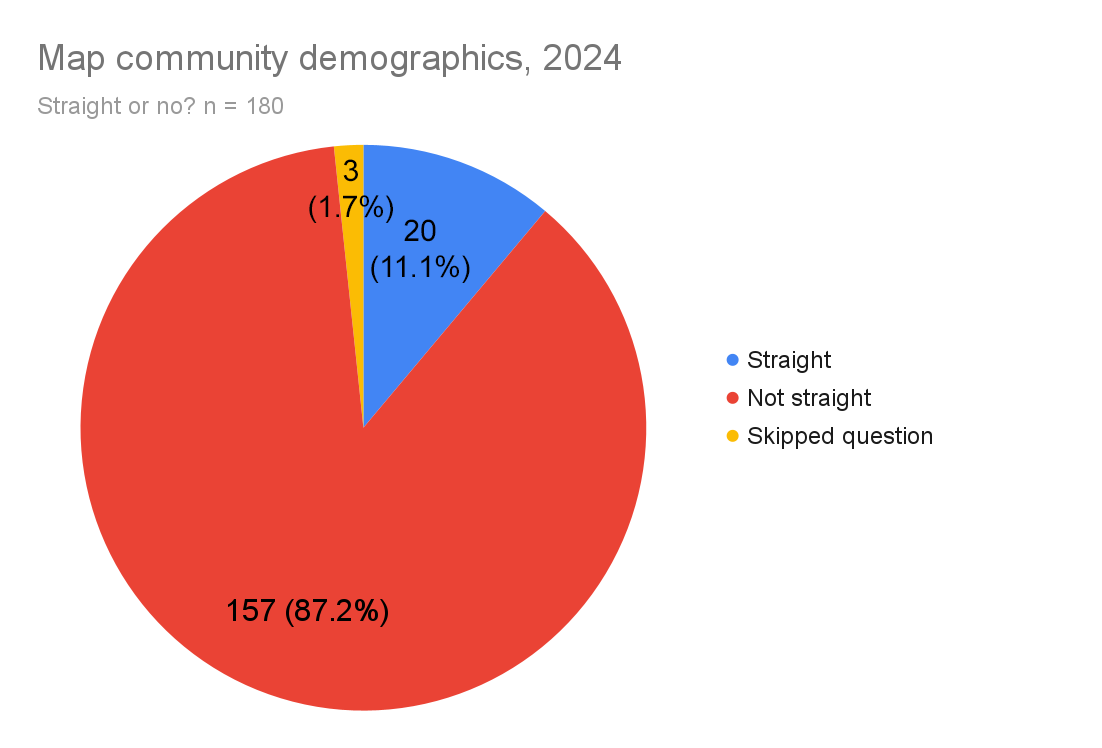
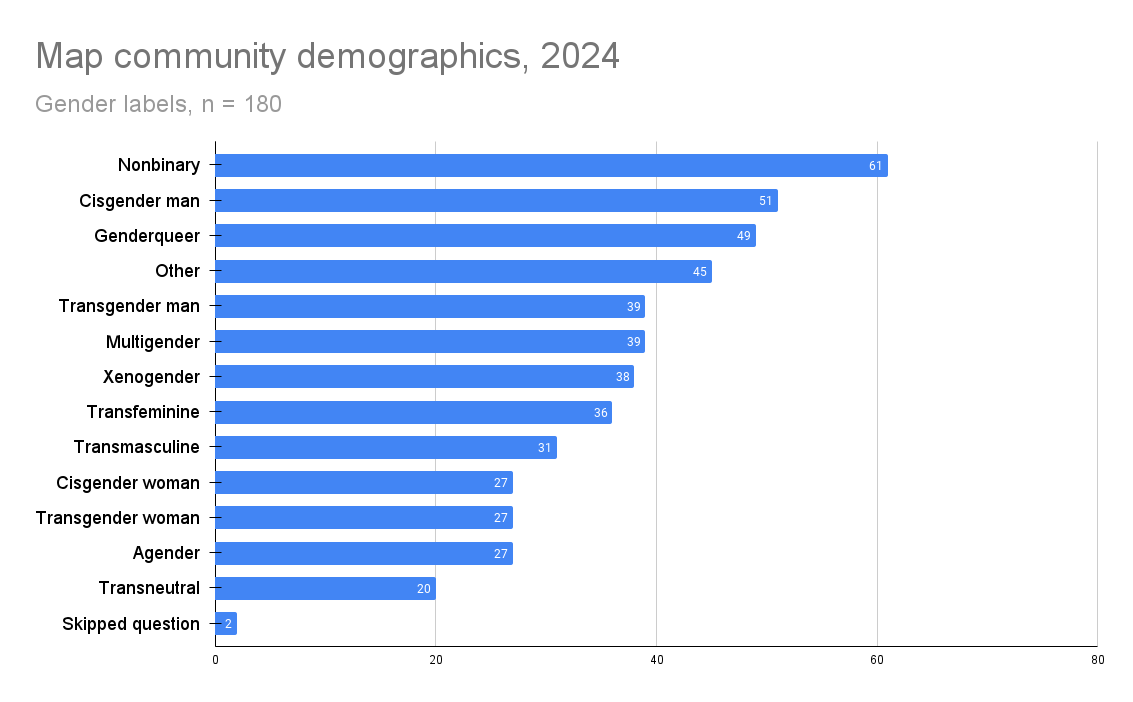
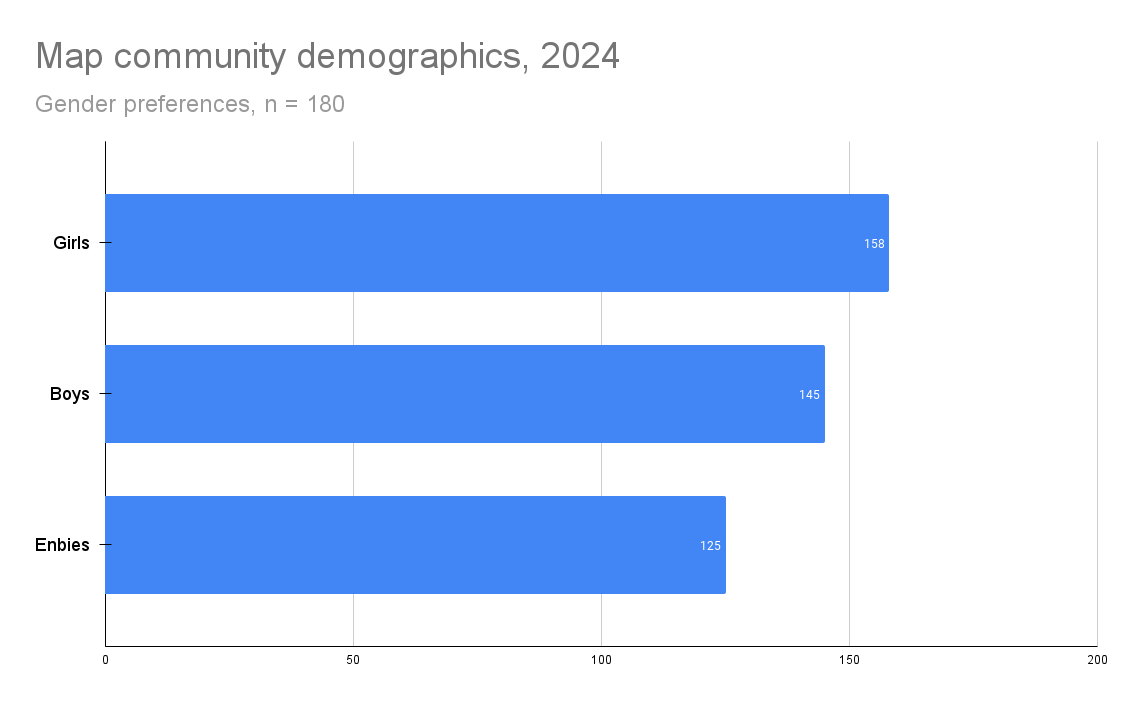
This year’s trends continue the pattern of high representation of nonbinary identities, equal distribution of agabs, overwhelming majority of nonstraight people, slight majority of trans people, and underrepresentation of women of any gender assignment. In comparison to 2022’s statistics, boys and girls changed places as the first and the second most popular gender preference. Enbies, despite prevalence of nonbinary maps, continue to be a less popular category of children, with 69% of the total number of respondents being attracted to them.
The change in format of the question about gender identities, dictated by the need to represent people who use multiple labels at once, is preventing me from comparing the old and new data in an adequate manner and checking whether the percentage of women continues decreasing (30% in 2018, 25% in 2020, 18% in 2022). In a way it may seem like it’s back up, but my old polls probably did not catch a lot of nonbinary women, who instead listed themselves as only nonbinary.
It is a little troubling to receive fewer results from women with time, because, even though we seem to have a good proportion of female instance admins and big name bloggers (such as Cummies, Kay Faraday, Katie, Rae, Lilitha), this tendency may indicate some hostility and difficulties women and girls deal with while entering the map community at low levels of power and popularity. Perhaps, in the future, I will make a poll addressing different genders in the map community and asking them whether their experience in the community has been positive or negative.
EDIT: here comes some additional analysis.
After looking at the original responses, I introduced a category I called “gender normative” – identifying only as cisgender, gender identity matching the agab. There were 39 gender normative men (22%) and 14 gender normative women (8%). In addition to that, I counted binary trans people – the ones who only identified themselves as trans male/trans male + transmasculine or trans female/trans female + transfeminine – and got 10 trans men (6%) and 10 trans women (6%).
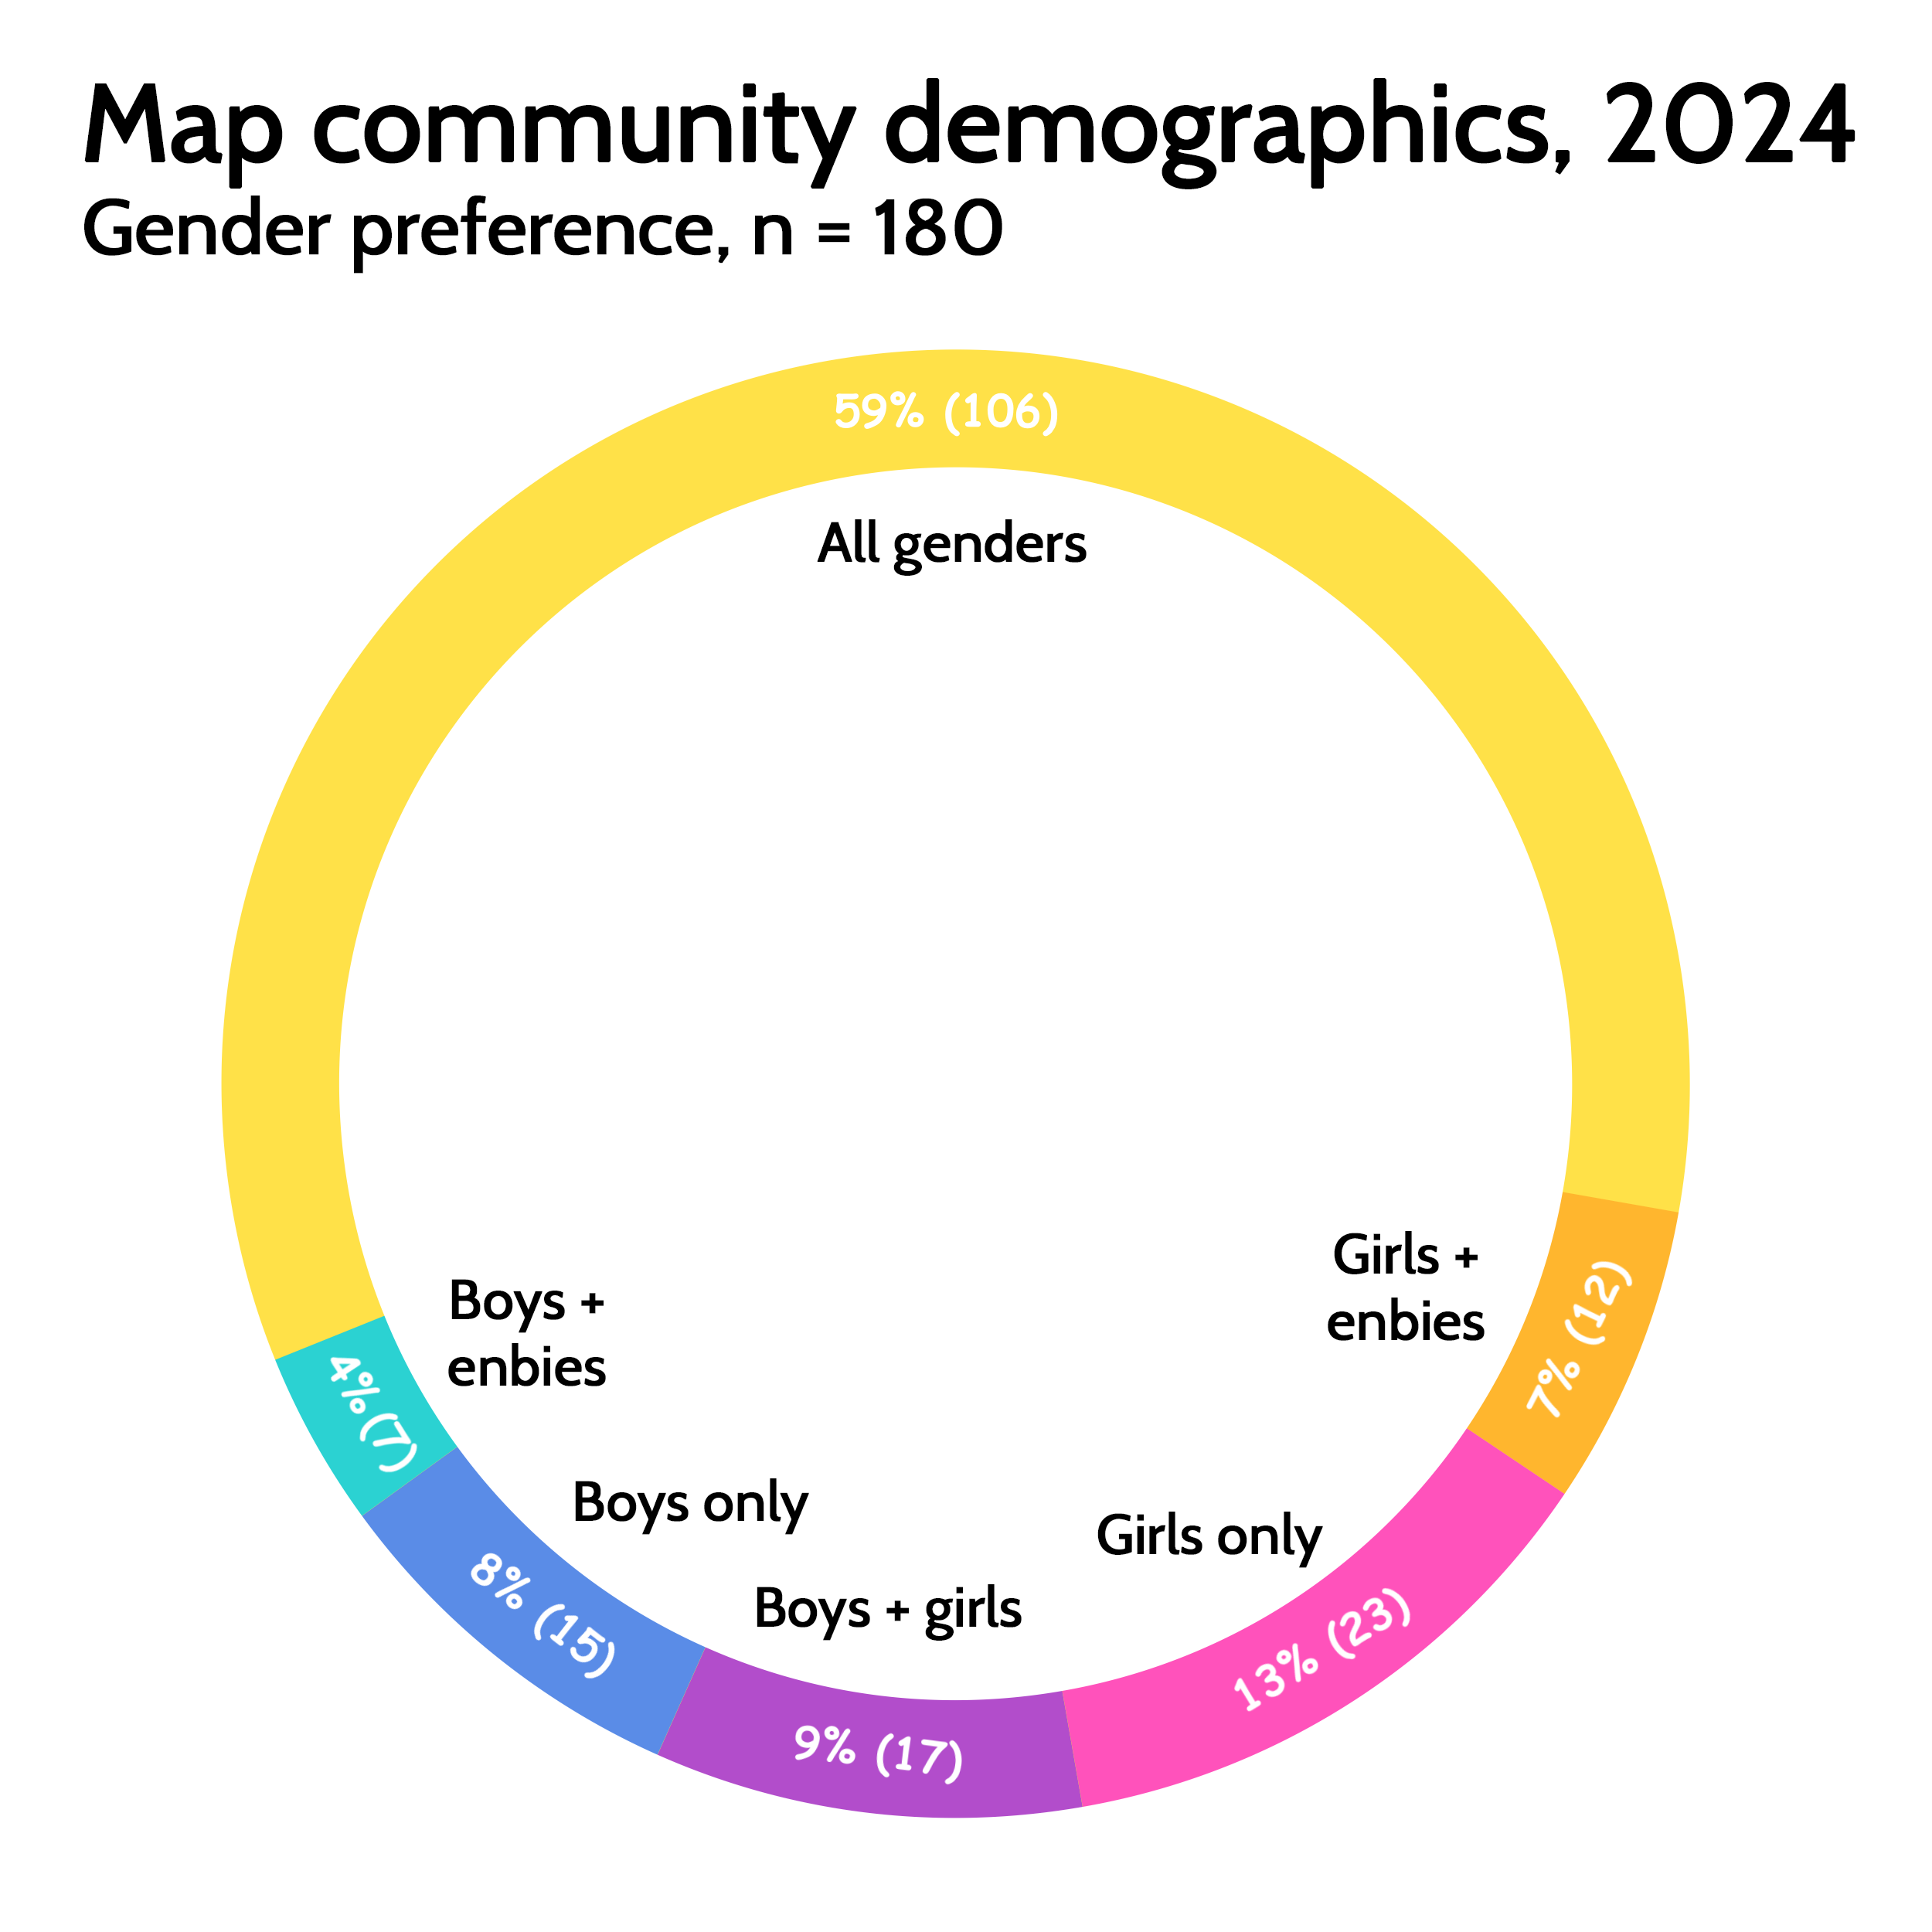
Also, here is a graph of how many people expressed what gender preference. Nobody expressed being exclusively into nonbinary children, which is in line with the 2022 survey results.
Leave a Reply